Access to Public Transit
Across Los Angeles County’s vast and sprawling 4,751 square miles, more than 4.5 million commuters walk, bike, drive, rideshare or take public transit to get to their jobs. Although it sounds like commuters can leverage a variety of options to get around, 73% of Angelenos drive alone to work and only 6.8% utilize public transit. In fact, transit ridership has declined more than 19% since 2013.
Despite these statistics – or perhaps because of them – voters in L.A. County have approved multiple historic tax increases in the past ten years to radically expand the existing public transit system. In 2008, voters approved Measure R, a half-cent sales tax increase that has been used to expand the Expo Line connecting downtown Los Angeles to Santa Monica, the Orange Line in the San Fernando Valley, the Silver Line connecting El Monte to the Harbor, and to expedite construction on the Green Line connection to LAX. More recently voters approved Measure M (a permanent extension of Measure R) which will be used to expedite transit projects such as the Purple Line extension to UCLA, the Gold Line extension to Claremont and dozens of other projects.
And yet the question asked by voters, residents, and public officials remains the same: will all of this investment in public transit encourage Angelenos to finally ditch their cars and increase their use of public transit? And perhaps more importantly, will Angelenos who rely on public transit for their daily commute continue to have access?
Transit Ridership on the Decline
L.A. County Metro, which is responsible for roughly 70% of the public transit system in the County, has recently focused on figuring out why transit ridership has declined despite recent investments, improvements and the addition of the popular Expo Line.
Bus and Light Rail Ridership
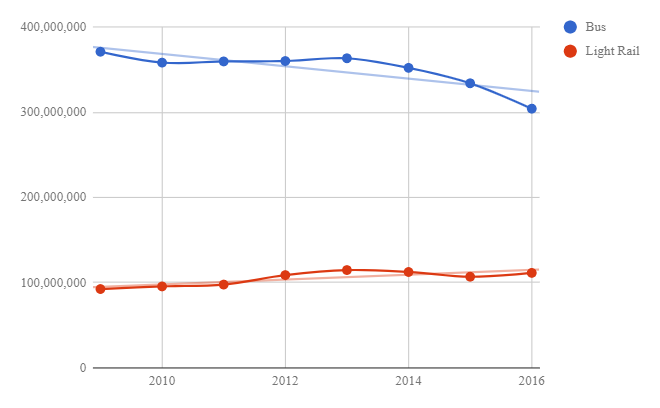
The decline in transit ridership has been fueled by a dramatic reduction in bus ridership. Metro’s transit ridership data goes back to 2009 where total annual bus boardings – boardings are the number of times passengers board a public transportation vehicle – peaked at 370,983,141. Bus boardings fell to 304,160,857 in 2016, while light rail transit has slowly increased from 92,540,577 boardings in 2009 to 111,458,473 boardings in 2016.
A recent Metro survey of public transit riders found one in five riders stopped using metro, citing slow speeds, difficulty getting to and from transit, and poor service reliability as the main reasons why they stopped using public transit.
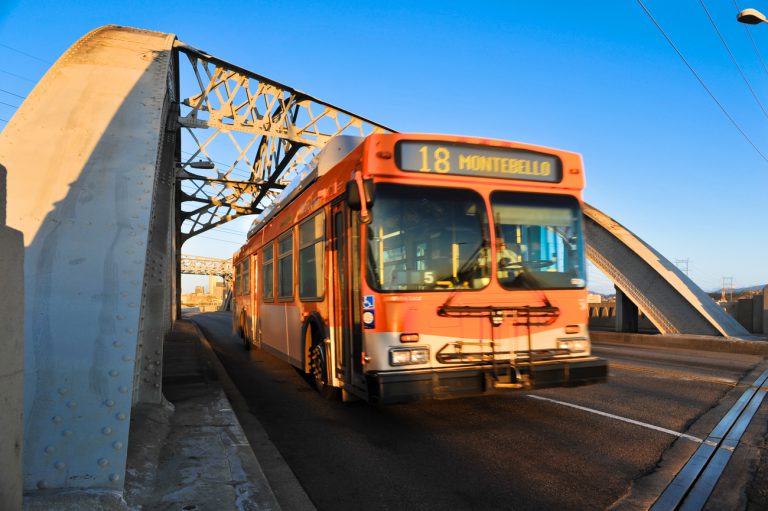
Bus riders are particularly affected by slow speeds caused by traffic and many riders rely on buses for their daily commutes. According to a survey of bus riders conducted by Metro, 84% of riders did not have a car to complete their trip and 70% ride the bus more than 5 days a week. 63% of riders surveyed have been riding Metro buses for than 5 years and the median total household annual earnings for those surveyed was $15,620.
Who is Most Affected?
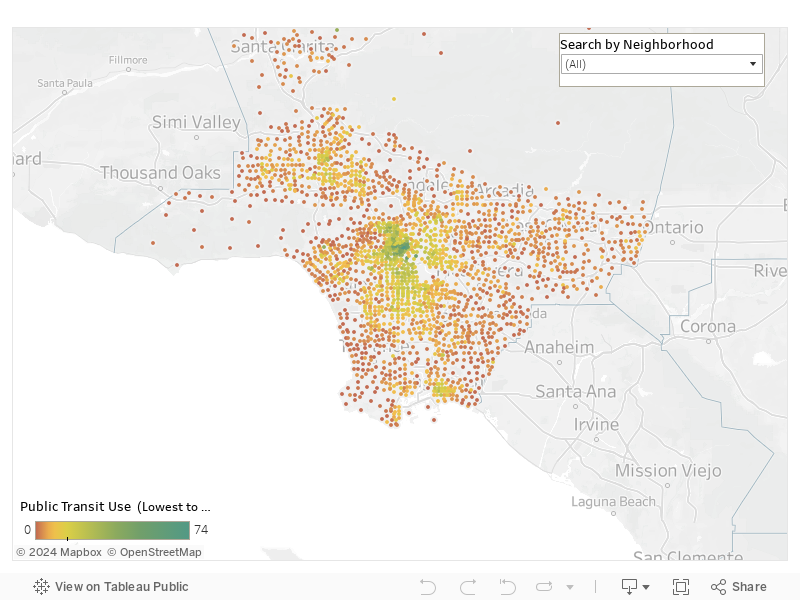
Neighborhoods with the highest percentage of transit riders are located near light rail or major bus corridors such as Westlake, Pico-Union, and Koreatown. These communities have diverse populations and lower median incomes than the County median. Moreover, the top 5 neighborhoods with the highest number of transit riders have an average median household income of $31,490 — significantly less than the median L.A. County household income of $56,196.
Ensuring Access to Transit
Rents in Los Angeles have continued to rise year after year and the 2017 USC Lusk Center’s Casden Economics Forecast estimates average monthly rents in the County will rise an additional $136 a month by 2019. If rents in neighborhoods near transit continue to increase, will current residents be able to afford access to the public transit many rely on to commute to work, school and run daily errands?
Transit-oriented development, the development of housing near transit hubs, can ensure residents have affordable housing options near the transit they rely on. A study from the National Center for Sustainable Transportation and USC found transit-oriented development increases transit ridership by low-income residents and provides low-cost access to employment opportunities. The study went as far as to say “ the collocation of affordable housing and light rail transit stations may introduce greater equity in employment access for lower-income residents.”
An innovative idea by USC Price Professors Marlon Boarnet and Gary Painter calls for Metro to create an Enhanced Infrastructure Financing District (EIFD) which would allow Metro to buy and develop affordable and market-rate housing near transit stations. Increasing the number of available housing options in transit-rich areas ensures new and current residents will be able to afford to take advantage of public transit.
Other researchers are proposing how Measure M could have an overall positive impact on low income communities and communities of color, including the Black Worker Center, the Los Angeles Regional Open Space and Housing Collaborative (LAROSAH), and USC Program for Environmental and Regional Equity (PERE). Measure M provides $860 billion in funding at a time when other crucial investments are being made in Parks, Housing, and Homelessness. The breadth and potential impacts of these funds can improve the social and economic conditions for the county’s most vulnerable and historically marginalized communities, if they are invested equitably. One particular effort that looks at equity in the implementation process is the Measures Matter study spearheaded by PERE which creates a roadmap for equitable implementation of Measures M and A and recommendations to infuse equity throughout both measures. For more information on how to get involved with the implementation process, please see their timeline which tracks the roll out of measure M as well as other major investments.
The Future of Transit
The passage of Measure M with two-thirds voter approval was a historic victory and will bring an estimated $860 million a year in new revenue. The opportunity to expand transit ridership and ensure residents that rely on public transit continue to have access to it is more important now than ever before.
We need to work toward choices that better serve Angelenos by providing them flexibility, comfort, and expediency. The future of transit in Los Angeles must ensure that residents of all incomes can afford to live close enough to these options to actually use them.

Juan Lopez
Juan Lopez is a first-generation American, a proud product of public schools and the first in his family to graduate college. Juan is currently pursuing a Masters in Public Administration at the University of Southern California Price School of Public Policy. He attended Long Beach City College and transferred to the University of Oregon where he graduated with a BA in Political Science. He most recently served as Director of Technology and Innovation in the Office of Los Angeles City Controller Ron Galperin. As a forward-thinking public servant, Juan focused on cutting red-tape, making government more efficient and making a meaningful difference in the lives of Angelenos. Juan loves hiking, writing, breakfast burritos, and road trips.
Sources
Boarnet, Marlon G, and Gary Painter. “Op-Ed How L.A. Can Improve Its Return on Our Multibillion-Dollar Transit Investment.” Los Angeles Times, Los Angeles Times, 16 May 2016, www.latimes.com/opinion/livable-city/la-oe-painter-boarnet-metro-value-capture-20160516-story.html.
Boarnet, Marlon, et al. “Affordable Housing in Transit-Oriented Developments: Impacts on Driving and Policy Approaches.” merritt.cdlib.org/d/ark:%252F13030%252Fm5xw9d3f/1/producer%252FNCST-201704.pdf.
Bureau, US Census. “471,000 Workers Commute into Los Angeles County, Calif., Each Day.” The United States Census Bureau, 5 Mar. 2013, www.census.gov/newsroom/press-releases/2013/cb13-r13.html.
Bus Results On-Board Customer Satisfaction Survey Los Angeles County Metro, Oct. 2016. media.metro.net/projects_studies/research/images/annual_survey_results/bus_results_spring_2016.pdf.
Los Angeles County Metro, June 2016. theplan.metro.net/wp-content/uploads/2016/10/factsheet_measurem.pdf.
“QuickFacts.” U.S. Census Bureau QuickFacts: Los Angeles County, California, www.census.gov/quickfacts/fact/table/losangelescountycalifornia/PST045216.
Tinoco, Matt. “Fewer People Are Taking Transit in LA-Here’s Why.” Curbed LA, Curbed LA, 29 Aug. 2017, la.curbed.com/2017/8/29/16219230/transit-metro-ridership-down-why.
Photo Attributions
Cover Photo: Photo courtesy of Istock/Mburnham
Photo 1: Photo courtesy of Istock/EHStock
Photo 2: Photo courtesy of Istock/Merkuri2
Photo 3: Photo courtesy of Istock/P_Wei
