Early Childhood Development in Westlake and Silver Lake
By age five, a child’s brain has grown to 90% of the size of an adult’s brain and developed more during those first few years than at any other time in their life. During this critical period, brains build neural connections between cells that influence how children move, communicate, emote, and think. This process, in turn, lays the foundation for healthy, capable, and successful adults. Nobel Prize-winning economist James Heckman confirmed the importance of this age group when his research found that every $1 invested in early childhood programs yields an average of $4 to $16 in returns.
This story explores the unique challenges facing organizations and communities looking to support children in this crucial stage of development and the strategies used to provide the environment, resources, and security young children need to learn and grow.
California Strong Start Index
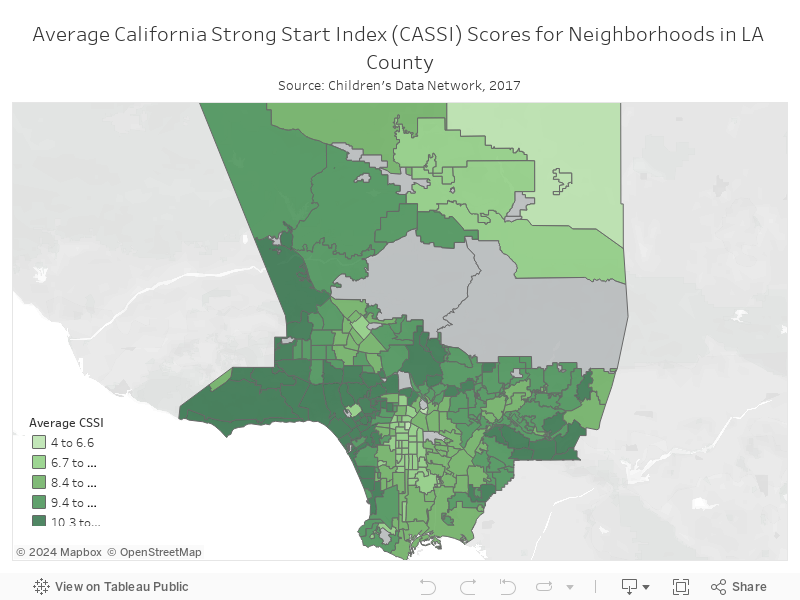
The significance of early childhood development is what motivated researchers at the Children’s Data Network to create the California Strong Start Index (CASSI) to identify the resources available to newborns from the very start of their lives. The California Strong Start Index summarizes the conditions into which children are born through variables that measure family, health, service, and financial assets available. The sum of these variables produces birth asset scores ranging from zero to 12 that allow researchers and policy-makers to compare resources across California.

Researchers working on the California Strong Start Index found that low scores are associated with two indicators of child well-being: involvement with child protective services or death by age 5. Therefore, lower scores can help identify which communities may benefit from additional support. The map below reveals two neighborhoods located right next to each other that have noticeably different scores. With a neighborhood average rating of 8, Westlake scores below the LA County average of 9.2. On the other hand, just next door in Silver Lake the highest scored census tract is 11.2 with a neighborhood average of 10.5. This story explores what underlying reasons might explain the differences between these two neighborhoods.
Explore the map below to see how California Strong Start Index scores in your neighborhood compare to those across LA County.
Redlining in Los Angeles
How is it that the conditions that children are born into can differ so much between two adjacent neighborhoods? The history of redlining in Los Angeles provides our first clue. In the 1930s, the Home Owners Loan Corporation (HOLC) started offering home loans with small down payments to encourage homeownership for the country’s growing middle class. However, the HOLC’s assessment of mortgage risk led to a harmful neighborhood surveying process known as redlining. The organization rated neighborhoods on an A through D scale based on their relative riskiness for investment and displayed these ratings on a color-coded map—using red for the lowest score.
Survey documents show that these ratings were based on racial stereotypes because the HOLC valued the perceived “stability” of mostly white, middle-class neighborhoods over the diversity of communities with large populations of immigrants and people of color. As a result, diverse communities of color were mainly coded as red, which diverted financial resources and opportunity away from them. The map below shows HOLC’s redlining of Los Angeles in 1939 with Westlake primarily coded red and Silver Lake blue.
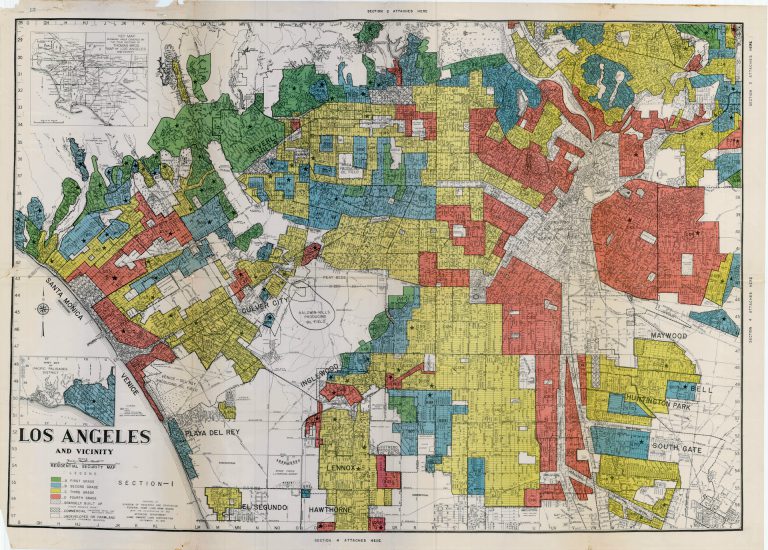
This structural bias has had long-term negative impacts on neighborhoods throughout Los Angeles, including Westlake. Residents of redlined neighborhoods struggled to get loans to start businesses and purchase homes, two economic engines of growth critical to building generational wealth. Furthermore, redlining denied neighborhoods home improvement loans, preventing communities from maintaining or renovating properties, which helped fuel a cycle of disrepair and blight that further reduced housing values.
Adverse Childhood Experiences
The economic disadvantages built into the system of redlining fostered economic inequality between neighborhoods in LA County that persists today. Data from the 2017 American Community Survey (ACS) shows that Westlake’s homeownership rate is 5% compared to 35% in Silver Lake. Relatedly, 36% of individuals in Westlake report incomes that are below the federal poverty line, compared to 17% countywide and 11% of Silver Lake residents. Whether through poor housing, insufficient mental or physical health services, distressed neighborhoods, or dysfunctional family life, research shows that economic inequality makes communities more susceptible to violence.
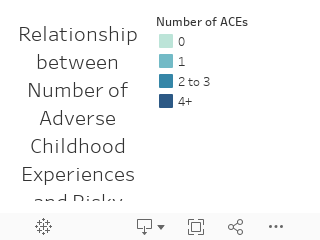
Young children exposed to poverty or violence are also significantly more likely to report adverse childhood experiences (ACEs), which sheds more light on the divergent birth asset scores of Westlake and Silver Lake. More than 60% of adults in LA County report experiencing one or more ACEs, which can include child abuse or neglect, violence inside or outside of the home, or a parent with substance abuse issues.
These experiences are especially influential at a young age because the toxic stress from traumatic events delays the development of neural pathways that determine how children learn, think, and behave. 2010 data displayed in the chart below illustrates the strong positive relationship between ACEs and risky health behaviors like smoking, binge drinking, and unsafe sex.
Research shows that these risky behaviors, in turn, contribute to negative mental and physical health outcomes, including anxiety, depression, asthma, heart disease, and diabetes. On top of health disparities, ACEs are found to affect learning and student success. Data from 2014 shows that 13% of children with two or more ACEs repeated a grade compared to only five percent of children with no ACEs.
These divergent health and education outcomes also appear in the comparison between Westlake and Silver Lake. Data from the 2017 ACS shows that 48% of students tested in Westlake fall outside of the Healthy Fitness Zone, compared to only 28% of Silver Lake students. Furthermore, the rate of chronic absenteeism, which is associated with lower academic performance, for students in Westlake is above the LA County average and three percentage points higher than the rate in Silver Lake.
Parent-Child Interaction Therapy
Despite the unfair starting point, communities like Westlake care deeply about cultivating healthy environments and supporting the development of their children. That’s why community health clinics in Westlake offer mental health services to families including therapy, rehab, and psychiatric services for individuals or groups.

In 2012, First 5 LA and the County of Los Angeles Department of Mental Health partnered up to invest $17 million in training and facility upgrades for childcare providers that offer Parent-Child Interaction Therapy (PCIT). PCIT directly targets behavioral problems by first establishing warmth in the child-caregiver relationship and then teaching parents strategies to help them manage challenging behaviors while staying calm, confident, and consistent in their approach to discipline. If you or someone you know could take advantage of these services, the Children’s Institute and St. Anne’s Maternity Home provide PCIT to Westlake residents through this partnership.

These investments from public partners, nonprofit organizations, and individual families show that communities in LA County care about improving conditions for their children. It offers hope that organizations, parents, and caregivers working collaboratively can prioritize early childhood development and in doing so fight to guarantee that every child has the care and resources they need to thrive.

Colin Caprara
Colin Caprara is a Research Assistant at Price Center for Social Innovation and a Master of Public Policy student at University of Southern California. As a public policy researcher, Colin is interested in using data to improve equitable access to education, housing, and employment. Prior to USC, Colin worked at Reno & Cavanaugh PLLC where he conducted legal and political research on public housing. Before that, Colin served the U.S. Senate Select Committee on Ethics where he researched Congressional history, parliamentary rules, and case law.
Sources
Chang, H. N., & Romero, M. (2008). Present, Engaged, and Accounted for: The Critical Importance of Addressing Chronic Absence in the Early Grades. Report. National Center for Children in Poverty. Accessed 9/12/2019 from: https://eric.ed.gov/?id=ED522725
Children’s Data Network (2019). California Strong Start Index. Accessed 9/12/2019 from: http://www.datanetwork.org/news/california-strong-start-index/
Felitti, V. J., Anda, R. F., Nordenberg, D., Williamson, D. F., Spitz, A. M., Edwards, V., … & Marks, J. S. (2019). Relationship of childhood abuse and household dysfunction to many of the leading causes of death in adults: The Adverse Childhood Experiences (ACE) Study. American journal of preventive medicine, 56(6), 774-786.
First 5 LA (2018). PARENT-CHILD INTERACTION THERAPY (PCIT). Accessed 9/24/2019 from: https://www.first5la.org/parent-child-interaction-therapy-pcit/
First Things First (2019). Brain Development. Accessed 9/12/2019 from: https://www.firstthingsfirst.org/early-childhood-matters/brain-development/
Lucile Packard Foundation for Children’s Health (2019). Prevalence of Adverse Childhood Experiences (Adult Retrospective). Accessed 9/12/2019 from: https://www.kidsdata.org/topic/95/childhood-adversity-and-resilience/summary
Nelson, Robert K., Winling, LaDale, Marciano, Richard, Conolly, Nathan, et al. (2019). “Mapping Inequality,” American Panorama, ed. Robert K. Nelson and Edward L. Ayers. Accessed 9/12/2019 from: https://dsl.richmond.edu/panorama/redlining/#loc=12/34.006/-118.355&city=los-angeles-ca&area=D33
Reft, Ryan (November 14, 2017). Segregation in the City of Angels: A 1939 Map of Housing Inequality in L.A.. KCET.Accessed 9/12/2019 from: https://www.kcet.org/shows/lost-la/segregation-in-the-city-of-angels-a-1939-map-of-housing-inequality-in-la
Photo Attributions
Cover Photo: Photo courtesy of Istock/peeterv
Photo 1: Photo courtesy of Istock/santypan
Photo 2:
Photo 3: Photo courtesy of Istock/kate_sept2004
Photo 4-6: Photos courtesy of Innovate Public Schools
