Small Business Lending Inequities during COVID-19
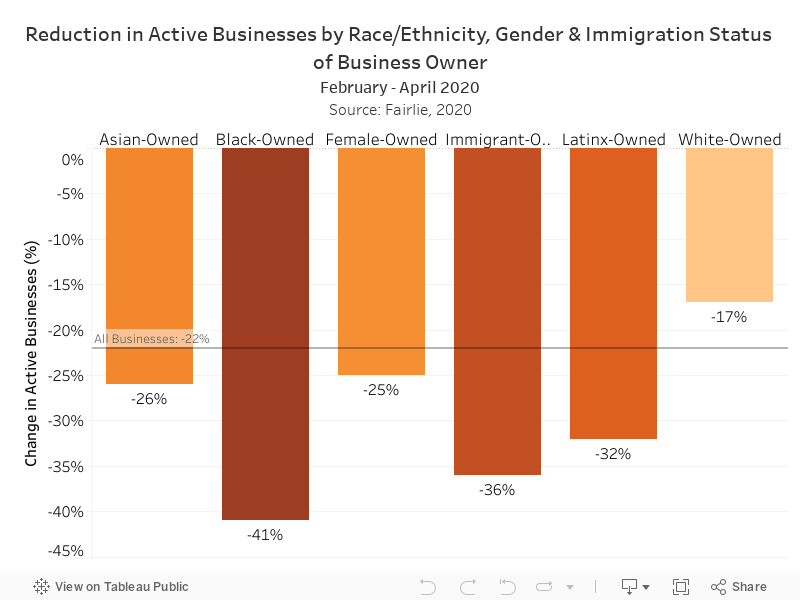
Nationwide, the COVID-19 crisis has shed light on the ways in which race and racism impact every aspect of our lives – from health and safety, to economic stability. As of October 2020, Black Americans were more likely to die from COVID-19 than those of any other racial group, and were nearly two and a half times more likely to die from the virus than white Americans. However, COVID-19 has negatively impacted Black communities in ways beyond health. A recent nationally representative survey found that there has been a 41% reduction in active Black-owned businesses compared to just 17% of white-owned businesses. The chart below shows the reduction in active businesses by various characteristics of the business owner.
Researchers have offered several reasons that help explain this disturbing trend. Black-owned businesses are more likely to be located in areas with high COVID-19 case rates. As a result, areas with higher concentrations of Black-owned businesses are more likely to concurrently experience issues such as longer forced closures, COVID-19 symptoms among employees, and fewer customers. Second, although the federal government has developed several aid programs (including the PaycheckProtection Program) to help mitigate the impact of COVID-19 on small businesses, business owners of color reported receiving the aid at much lower rates than all business owners. A recent survey found that just 12% of Black and Latinx business owners received the COVID-related aid they requested from the federal government. By comparison, 38% of small business owners of all races reported receiving the aid they requested in a survey conducted during a similar time period. While the small business aid programs are unique to the COVID-19 pandemic, racial disparities in loan distribution are rooted in discriminatory practices from long before the current pandemic.
Racial Disparities in Business Loans
Across the U.S., banks and other non-regulated lenders have historically excluded borrowers in low-income communities of color from accessing capital and related financial services through a practice of exclusion known as redlining (read more about redlining here). While redlining was outlawed in 1968 by the Fair Housing Act, the effects of this discriminatory practice continue to impact communities of color and small businesses owned by people of color today.
In 1977, Congress enacted the Community Reinvestment Act (CRA), which requires the Federal Reserve and other federal banking regulators to encourage financial institutions to help meet the credit needs of the communities in which they do business, including low-and moderate-income neighborhoods. However, since the law was passed, banks and federal banking regulators have struggled to implement the delivery of products that bring low and moderate income neighborhoods into parity with higher income white neighborhoods.


A 2018 study conducted by the National Community Reinvestment Coalition (NCRC) in Los Angeles found that bank personnel introduced themselves less frequently to Black study participants than they did to white participants, and provided significantly less information to Black and Latinx participants regarding business loan products. This ongoing pattern of disparate treatment may have been an important consideration for the Office of the Comptroller of the Currency to launch its two-year process to modernize the Community Reinvestment Act.
Systemic acts of racism against Black and Latinx business owners have predictably led to a banking culture that develops fewer relationships between banks and business owners of color, despite the critical role that banks play in financing small business growth. A 2019 survey found that just 23% of Black-owned businesses have had a recent borrowing relationship with a bank compared to 46% of white-owned businesses. The absence of banking relationships has likely had an outsized impact on Black-owned businesses during the pandemic, as many banks who are distributing federal aid dollars are only accepting applications from existing customers through their network of relationship managers. Without a relationship manager, most Black businesses have stood at the rear of the line.
The Paycheck Protection Program
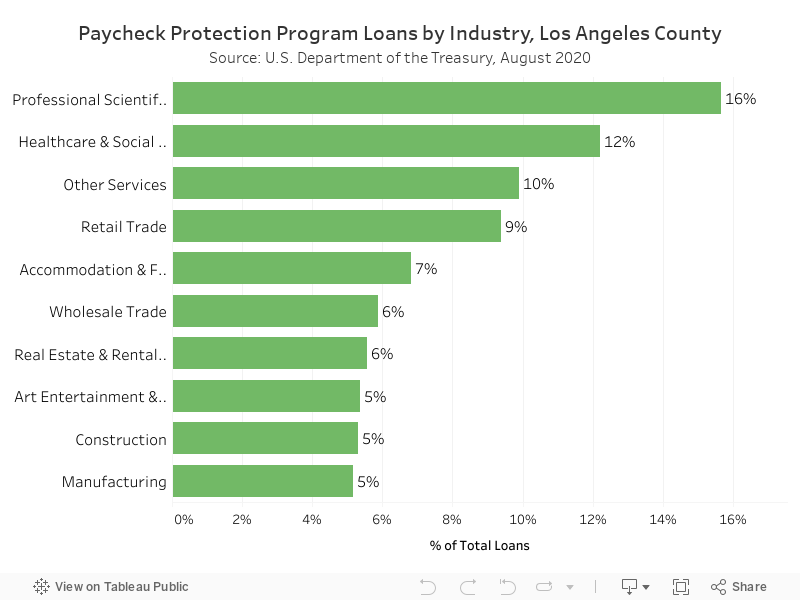
In Los Angeles County, banks have distributed over 192,000 loans through the Small Business Administration’s Paycheck Protection Program (PPP). Over half of the loans in the County were concentrated across five sectors, including: professional, scientific & technical services (16%); healthcare and social assistance (12%); retail trade (9%); accommodation & food services (7%); and other services (10%). The chart to the left shows the sectors with the largest share of PPP loans in the County.
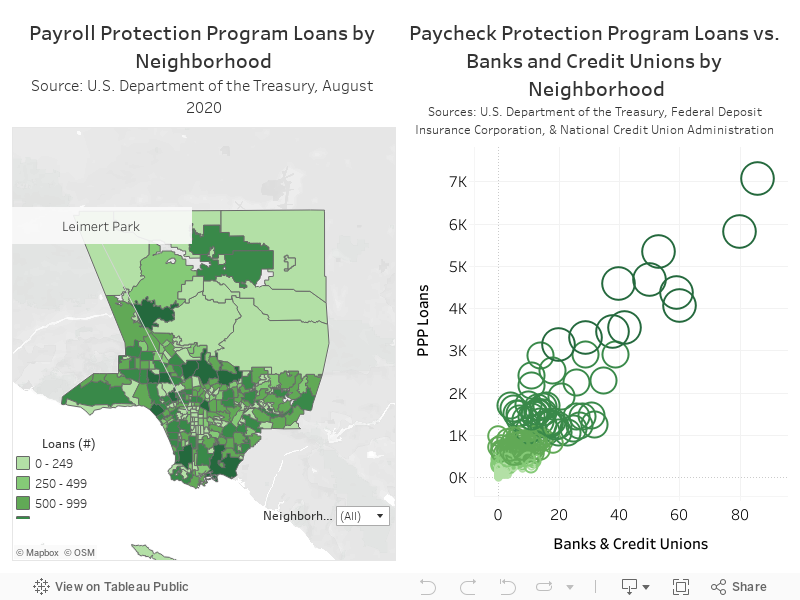
The number of PPP loans received by small businesses varies widely across neighborhoods – ranging from 7,069 loans in Downtown LA to one loan in Rolling Hills. Neighborhoods that received a higher number of loans also tend to have a larger share of residents who identify as white. 21 out of the top 25 neighborhoods have a higher white population than the county average of 27%. Additionally, these neighborhoods had three times as many banks and credit unions per neighborhood (24) than the county average (8).
The bubble graph below shows the positive relationship between the number of banks/credit unions and PPP loans in a neighborhood. The neighboring map shows the number of PPP loans by neighborhood geographically, with darker colors indicating more loans.
Hover over a neighborhood to see the number of loans, banks and credit unions, and racial/ethnic makeup of its residents.
LA's Historically Black Neighborhoods
Leimert Park, View Park-Windsor Hills, Baldwin Hills/Crenshaw and West Adams are a group of neighboring communities in the South LA region of the County. 53% of the population in the neighborhoods identify as Black or African American, which is well over the County average of 8%. Over half of the jobs in these neighborhoods are concentrated in three sectors, including: (1) healthcare and social assistance (25%), (2) retail trade (18%), and (3) accommodation and food services (9%). Although these sectors were among those that received a higher proportion of PPP loans across the County, these neighborhoods (along with many of the other neighborhoods in South L.A.) have received significantly fewer loans than those in other parts of the County. These South LA neighborhoods received an average of 259 loans per neighborhood, less than a third of the county average of 737. Additionally, they have an average of just four banks per neighborhood compared to the county average of 8, demonstrating a substantial lack of access to bank offices to meet their credit needs.


Although Leimert Park and its neighboring communities received fewer than a third of the PPP loans of an average LA County neighborhood, businesses in these and other communities of color would have disproportionately benefited from a loan program designed to direct incentives for small businesses to keep their workers on payroll. Prior to the pandemic, rent burden (a common measure of housing affordability) in Leimert Park and the surrounding area had been steadily on the rise. As of 2018, 64% of residents were paying more than a third of their incomes on rent, compared to an average of 55% of residents across the County. Housing affordability doesn’t directly impact small businesses; however, rent-burdened households are forced to make tough decisions about where to cut costs and have less disposable income to spend on basic goods and services at local businesses. While neighborhood-level data is not yet available for the current year, national data shows that the pandemic has exacerbated housing affordability and other economic challenges in Black and Latinx communities. This phenomenon was highlighted in a recent report by the Committee for a Greater LA:
In many ways, COVID-19 is the disease that has revealed our social illnesses of anti-Black racism, precarious employment, sharp racial gaps in wealth and digital access, unaffordable housing, growing homelessness, unresponsive government, and so much more.
Community Development Financial Institutions
Black-owned businesses and communities of color have historically faced, and continue to face, exclusion and disinvestment from many traditional financial institutions. However, other types organizations have stepped in to provide financial resources to those who have historically lacked access. Community development financial institutions (CDFIs) are private financial institutions with a mission of providing affordable lending to help disadvantaged communities join the economic mainstream. CDFIs provide lending to a number of sectors including small business owners, non-profits, commercial real estate developers and affordable housing developers. According to the Opportunity Finance Network and the U.S. Treasury Department, there are over 1,100 CDFIs operating in all 50 states, including 98 in the state of California and 23 in Los Angeles County.
Los Angeles Local Development Corporation (LDC) is a CDFI founded in 1980 to serve Los Angeles neighborhoods that suffered from redlining and other forms of disinvestment. Their clients include businesses and organizations in Leimert Park, View Park-Windsor Hills, Baldwin Hills/Crenshaw and West Adams, and many other neighborhoods. Since 1995 they have facilitated over $400 million of financing with borrowers operating in historically low income and disinvested communities throughout California, with a primary focus in Los Angeles.
Since the start of the pandemic, Los Angeles LDC has been working to identify strategies that bring greater innovation and access to a variety of capital and advisory services for Black and Latinx-owned businesses in the Los Angeles area. It has a successful track record in raising and deploying capital from regulated financial institutions in a private equity structure, with a $10 million portfolio of loans where 85% of the borrowers were people of color.

Elly Schoen
Elly Schoen serves as the Data & Project Manager at the USC Price Center for Social Innovation. In this role, Elly provides project management for the Price Center’s Neighborhood Data for Social Change platform, as well as the Homelessness Policy Research Institute.
Sources
The Atlantic (2020). “The COVID Tracking Project.” from https://covidtracking.com/race.
Fairlie, Robert W. (2020). “The Impact of Covid-19 on Small Business Owners: Evidence of Early-Stage Losses from the April 2020 Current Population Survey.” from https://www.nber.org/papers/w27309.
Mills, Claire Kramer, et al. (2020). “Double Jeopardy: COVID-19’s Concentrated Health & Wealth Effects in Black Communities.” from https://www.newyorkfed.org/medialibrary/media/smallbusiness/DoubleJeopardy_COVID19andBlackOwnedBusinesses.
Global Strategy Group. “Federal Stimulus Survey Findings.” from https://theblackresponse.org/wp-content/uploads/2020/05/COC-UnidosUS-Abbreviated-Deck-F05.13.20.pdf
Omeokwe, Amara (2020). “Coronavirus Drives 75% of Small Businesses to Seek Federal Aid,” The Wall Street Journal from https://www.wsj.com/articles/coronavirus-drives-75-of-small-businesses-to-seek-federal-aid-11589476452
Lee, Amber, et al. (2019). “Disinvestment, Discouragement & Inequity in Small Business Lending.” National Community Reinvestment Coalition from https://ncrc.org/wp-content/uploads/2019/09/NCRC-Small-Business-Research-FINAL.pdf.
Fed Small Business (2019). “Report on Employer Firms Based on the 2020 Small Business Credit Survey.” from https://www.fedsmallbusiness.org/survey/2020/report-on-employer-firms
Lopez, Mark Hugo, et al. (2020). “Financial and health impacts of COVID-19 vary widely by race and ethnicity.” Pew Research Center from https://www.pewresearch.org/fact-tank/2020/05/05/financial-and-health-impacts-of-covid-19-vary-widely-by-race-and-ethnicity/
Opportunity Finance Network. “About CDFIs.” from https://ofn.org/CDFIs
Photo Attributions
Cover Photo: Photo courtesy of Istock/Kim Grosz
Photo 1: Photo courtesy of Istock/AndreyPopov
Photo 2: Photo courtesy of Istock/dcdebs
Photo 3: Photo courtesy of Istock/GaryKavanagh
Photo 4: Photo courtesy of Istock/Gwengoat
Photo 5: Photo courtesy of Los Angeles LDC
