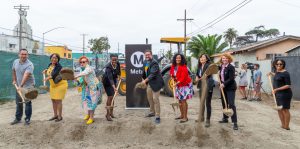
Celebrating 10 Years of SLATE-Z
Celebrating 10 Years of SLATE-Z A Legacy of Cultural Richness South Los Angeles has long been a place of cultural vibrancy, tracing its roots to
Celebrating 10 Years of SLATE-Z A Legacy of Cultural Richness South Los Angeles has long been a place of cultural vibrancy, tracing its roots to
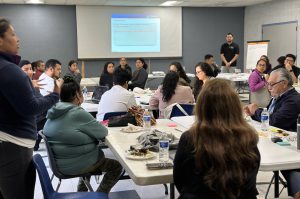
Advancing a Collaborative Agenda in Southeast LA In 2022, the California Community Foundation (CCF) launched the Regional Recovery Hub to strengthen place-based coordination in Los Angeles County
In 2022, the California Community Foundation (CCF) launched the Regional Recovery Hub to strengthen place-based coordination in Los Angeles County regions that were most heavily impacted by
