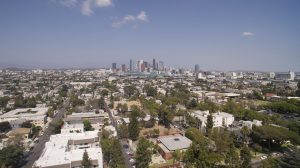
Home Affordability in the USC Area
In 2006, when USC began planning its new mixed-use “Village” development, the UNIDAD Coalition ––a group of community-based organizations in South Central–– arose to ensure
Variable Definitions:
Recent Movers, All Units: The share of households that moved into their current place of residence within the last two years
Recent Movers, Homeowner Units: The share of owner-occupied households that moved into their current place of residence within the last two years
Recent Movers, Renter Units: The share of renter-occupied households that moved into their current place of residence within the last two years
Source:
American Community Survey, 5-year estimates, Table B25038
Years Available:
2017, 2019, 2021, 2023
*Note: Each year of available data shown above is a 5-year estimate, or an average of data collected over a five year period. 5-year estimates are used to increase the reliability of the data at small geographies like neighborhoods and census tracts. The years shown on the NDSC map represent the final year of the five year average (e.g. “2010” represents 2006-2010 data, “2011” represents 2007-2011 data, and so on). For the most impactful comparison of data over time, the ACS recommends comparing non-overlapping years (e.g. 2010-14 with 2015-19).
Methodology Note:
Recent movers refers to the share of households that moved into their current residence within the past two years, distinguishing between renter- and owner-occupied housing units. This indicator is frequently used to identify neighborhood mobility, population turnover and residential stability (U.S. Census Bureau, 2024). In general, renters relocate far more often than homeowners, but Los Angeles exhibits particularly strong spatial variation even within these tenure statuses across the county (Clark & Ledwith, 2024). Recent-mover rates tend to be much lower in more stable suburban neighborhoods compared to other highly dynamic urban cores such as Downtown, Culver City, and Playa Vista. By splitting the dataset between renters and homeowners, this dataset allows researchers to examine how tenure type interacts with affordability, neighborhood change, and housing market stress.
A high share of recent movers may signal rapid neighborhood turnover, new housing development, and potential gentrification pressures. Areas such as Downtown LA, Koreatown, and Hollywood exhibit relatively higher mover rates, paralleling “early or ongoing gentrification” zones identified by the UC Berkeley Urban Displacement Project (2023). These districts have attracted younger, higher-income residents and new development, leading to rising rents and visible demographic restructuring (Hendrix, 2024; Los Angeles Times, 2024). Conversely, districts in South and East LA show much lower shares of new residents—suggesting relative residential stability, though often coupled with rent burden and limited mobility. As UCLA’s Equitable Rent and Mobility and Housing Stress studies note, declining construction and rising renewal rates have constrained mobility even in western sub-markets such as Marina del Rey and Culver City, where lease renewal rates climbed markedly after 2023 (Clark & Ledwith, 2024; NMHC, 2025).
Breaking down recent-mover data by renters and homeowners helps reveal distinct patterns of neighborhood change. Renter units in Los Angeles can exhibit turnover as high as 54 percent, compared with roughly 35 percent among homeowner units—reflecting renters’ greater exposure to market volatility (National Low Income Housing Coalition, 2025). Homeowners generally display lower mobility, yet “exit effects” arise when property appreciation encourages sales and reinvestment (Hendrix, 2024). Understanding these distinctions enables policymakers to identify where change stems from renter displacement versus owner replacement, illuminating how mobility interacts with affordability, stability, and demographic transformation across Los Angeles’ evolving urban landscape.
See also: Median Rent for Recent Movers
Written by Katherine Ding
Citations:
Clark, W. A. V., & Ledwith, V. (2024). Mobility, housing stress and neighborhood contexts: Evidence from Los Angeles. UCLA Center for Population Research. Link
Hendrix, R. (2024). Spatial mobility and neighborhood shifts in L.A. County. UCLA Anderson Forecast. Link
Los Angeles Times. (2024). Why Downtown L.A. still draws residents despite its problems. Los Angeles Times Housing Series. Link
Los Angeles Times. (2025). With a surging residency rate, this neighborhood is transforming L.A. Link
National Low Income Housing Coalition (NLIHC). (2025). Recent movers are more likely to switch between owning and renting than vice versa. Link
National Multifamily Housing Council (NMHC). (2025). Impact of new development on renter mobility in a changing housing market. Link
UC Berkeley Urban Displacement Project. (2023). Los Angeles – Gentrification and displacement map. Link
U.S. Census Bureau. (2024). Historical Census of Housing Tables: Recent Movers. Link

In 2006, when USC began planning its new mixed-use “Village” development, the UNIDAD Coalition ––a group of community-based organizations in South Central–– arose to ensure

According to the Economic Policy Institute (EPI), 8.4 million jobs have been lost since the start of the pandemic in February 2020, and over 5 million people

Across the nation, the population experiencing homelessness is getting older. The end of the Baby Boomer generation (those born between 1955 and 1964) have faced
