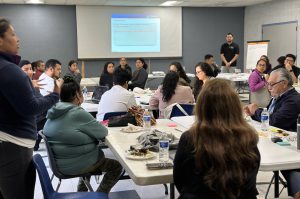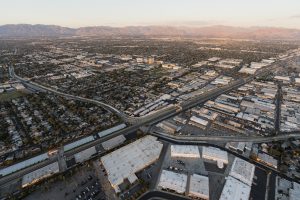
Advancing a Collaborative Agenda in Southeast LA
Advancing a Collaborative Agenda in Southeast LA In 2022, the California Community Foundation (CCF) launched the Regional Recovery Hub to strengthen place-based coordination in Los Angeles County
Variable Definitions:
All Green Coverage: the share of land surface covered by green vegetation including tree canopies, public greenspaces, sidewalk plantings, green roofs, and residential gardens.
Public Access Park Green Coverage: the share of public access park land covered by green vegetation such as grass, meadows, and tree canopies in a given area. Public access parks include local parks, natural areas, regional open spaces, and regional recreation parks, but do not include golf courses and schools.
Source:
Original Data pulled from The National Agriculture Imagery Program (NAIP) in Google Earth Engine Datasets. Data calculated and processed by Jiyoon Kim, Ph.D. student in Urban Planning and Development
Years Available:
2009, 2012, 2014, 2016, 2018, 2020, 2022
Methodology Note:
The original data comes in raster images with a 0.6m resolution for the years 2016-2022 and with a 1m resolution for the years 2009-2014. Our team calculated the Normalized Difference Vegetation Index (*NDVI) and determined the share of the area covered by vegetation (NDVI value above 0.2) in a given area.
Citations:
Connolly, R., Lipsitt, J., Aboelata, M., Yañez, E., Bains, J., & Jerrett, M. (2023). The association of green space, tree canopy and parks with life expectancy in neighborhoods of Los Angeles. Environment International, 173, 107785. doi:10.1016/j.envint.2023.107785
Environmental Protection Agency. (2021). Using trees and vegetation to reduce heat islands. United States Environmental Protection Agency. Link
Esri. (2024). NDVI function. NDVI function—ArcGIS Pro | Documentation
Herold, M., Couclelis, H., & Clarke, K. C. (2005). The role of spatial metrics in the analysis and modeling of urban land use change. Computers, Environment and Urban Systems, 29(4), 369-399. doi:10.1016/j.compenvurbsys.2003.12.001
Kim, D., & Ahn, Y. (2021). The contribution of neighborhood tree and greenspace to asthma emergency room visits: An application of advanced spatial data in Los Angeles County. International Journal of Environmental Research and Public Health, 18(7), 3487. doi:10.3390/ijerph18073487
Wolch, J. R., Byrne, J., & Newell, J. P. (2014). Urban green space, public health, and environmental justice: The challenge of making cities ‘just green enough’. Landscape and Urban Planning, 125, 234-244. doi:10.1016/j.landurbplan.2014.01.017
Yin, Y., He, L., Wennberg, P. O., & Frankenberg, C. (2023). Unequal exposure to heatwaves in Los Angeles: Impact of uneven green spaces. Science Advances, 9(17), eade8501. doi:10.1126/SCIADV.ADE8501
Zupancicm, T., Westmacott, C., Bulthuis, M. (2017). The impact of green space on heat and air pollution in urban communities: A meta-narrative systematic review. David Suzuki Foundation. Link

Advancing a Collaborative Agenda in Southeast LA In 2022, the California Community Foundation (CCF) launched the Regional Recovery Hub to strengthen place-based coordination in Los Angeles County

In 2022, the California Community Foundation (CCF) launched the Regional Recovery Hub to strengthen place-based coordination in Los Angeles County regions that were most heavily impacted by
