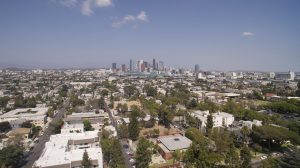
Home Affordability in the USC Area
In 2006, when USC began planning its new mixed-use “Village” development, the UNIDAD Coalition ––a group of community-based organizations in South Central–– arose to ensure
Variable Definitions:
Housing Units by Decade: The percentage of housing units in a given area that were built in the following time periods:
Source:
American Community Survey (ACS), 5-year estimates, Table B25034
Years Available*:
2010 – 2023
*Note: Each year of available data shown above is a 5-year estimate, or an average of data collected over a five year period. 5-year estimates are used to increase the reliability of the data at small geographies like neighborhoods and census tracts. The years shown on the NDSC map represent the final year of the five year average (e.g. “2010” represents 2006-2010 data, “2011” represents 2007-2011 data, and so on). For the most impactful comparison of data over time, the ACS recommends comparing non-overlapping years (e.g. 2010-14 with 2015-19).
The number of housing units constructed in a given year determines the age of the housing stock. A key determinant of the renovation market is the age of the home stock. Compared to new houses, older ones are less energy-efficient and need more upkeep and restoration over time.
Long-term demand for new constructions is anticipated to increase due to the aging housing stock as older homes deteriorate and need to be replaced. Throughout the first half of the 20th century, Los Angeles’ landlords, construction companies, and real estate developers constructed a wide range of housing styles in significant quantities, from house courts to blocks of single-family houses, mainly in the center of Los Angeles. Later, fast suburban sprawl and spacious single-family homes came to represent postwar prosperity, such as the San Fernando Valley (SACRPH, n.d)

In 2006, when USC began planning its new mixed-use “Village” development, the UNIDAD Coalition ––a group of community-based organizations in South Central–– arose to ensure

According to the Economic Policy Institute (EPI), 8.4 million jobs have been lost since the start of the pandemic in February 2020, and over 5 million people

Across the nation, the population experiencing homelessness is getting older. The end of the Baby Boomer generation (those born between 1955 and 1964) have faced
